5 Data Sets on Personal Preferences
📑 10 slides
👁 24 views
📅 1/27/2026
Introduction to the Data Sets
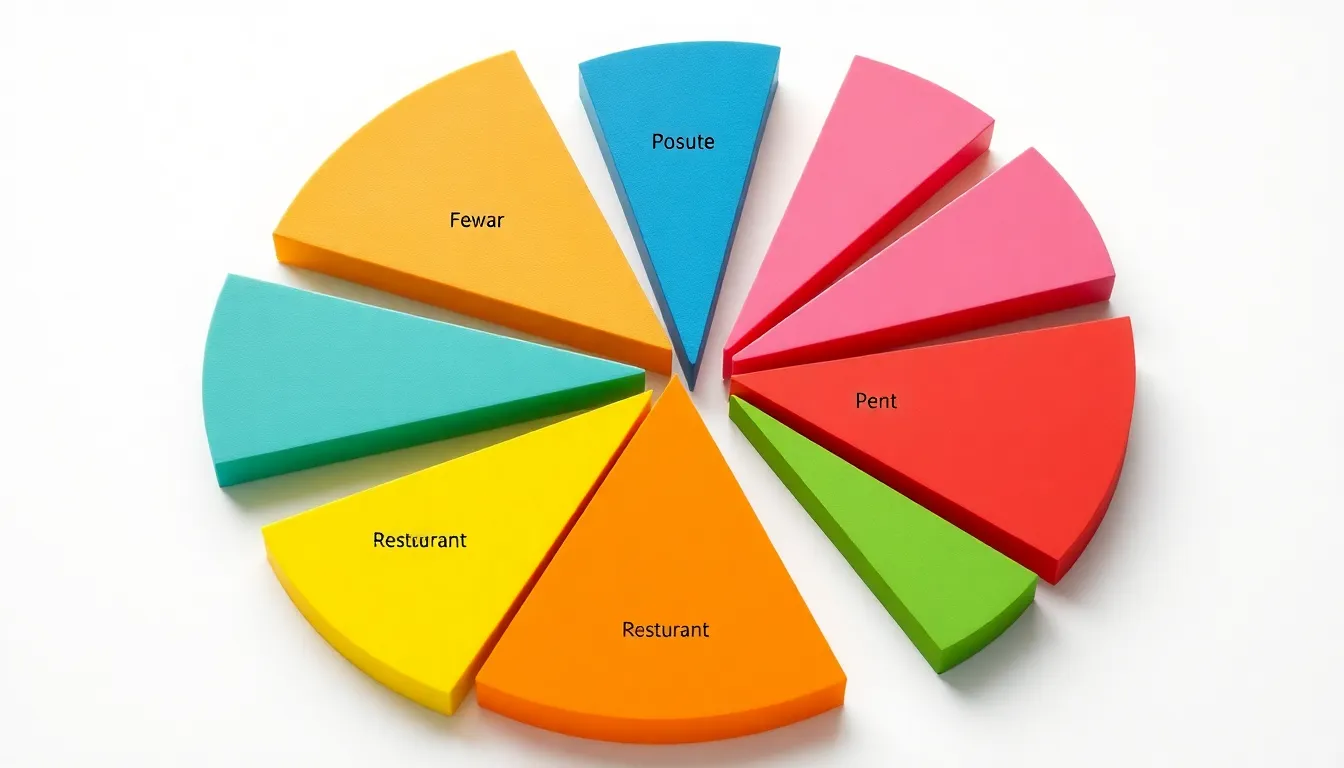
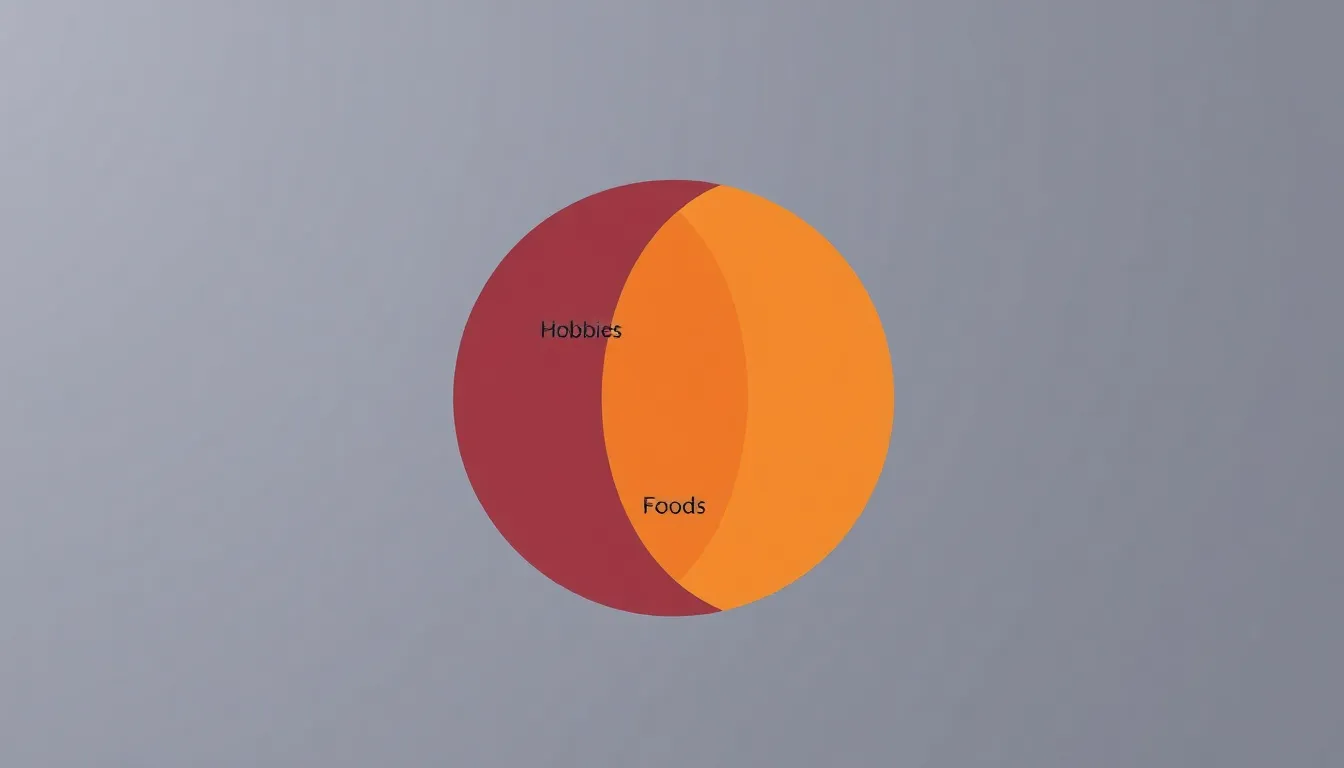
Analyzed responses from 40 people on personal preferences like favorite colors and restaurants.
2
Favorite Colors: Bar Graph
- Blue was the most popular color, chosen by 12 out of 40 participants.
- Red and green tied for second place with 8 votes each.
- Purple and yellow were the least preferred colors with 5 and 7 votes.
3
Favorite Restaurants: Pie Chart
- Chick-fil-A was the top choice with 15 out of 40 votes.
- Kane's and McDonald's followed with 10 and 8 votes respectively.
- Local restaurants accounted for the remaining 7 votes.
4
Favorite Foods: Line Graph
- Pizza was the most loved food, with 18 participants choosing it.
- Burgers and sushi followed with 12 and 6 votes respectively.
- Salads and pasta rounded out the list with 3 and 1 votes.
5
Hobbies: Stacked Bar Graph
- Reading was the most common hobby, with 14 participants listing it.
- Sports and cooking were next with 10 and 8 votes respectively.
- Gardening and painting had the least interest with 5 and 3 votes.
6
Favorite Music Genres: Scatter Plot
- Pop music was the favorite, with 16 out of 40 participants preferring it.
- Rock and hip-hop followed with 12 and 7 votes respectively.
- Classical and jazz were the least popular with 3 and 2 votes.
7
Trends in Color Preferences
- Younger participants (18-25) preferred brighter colors like yellow and red.
- Older participants (26-40) leaned towards muted tones like blue and green.
- No significant gender-based differences in color preferences were noted.
8
Restaurant Preferences by Age
- Participants aged 18-25 favored fast food chains like McDonald's.
- Those aged 26-40 preferred sit-down restaurants like Kane's.
- Local restaurants were equally popular across all age groups.
9
Correlation Between Hobbies and Food
- Participants who enjoyed cooking also preferred healthier food options.
- Those into sports tended to favor high-protein foods like burgers.
- Readers often chose quick and easy meals like pizza.
10
Conclusion and Key Takeaways
- Blue and Chick-fil-A emerged as the most popular color and restaurant.
- Age and hobbies significantly influenced food and music preferences.
- Visual data representations helped clearly identify trends and patterns.
1 / 10