Bridging the Wealth Gap: A Global Imperative

📑 10 slides 👁 43 views 📅 1/22/2026
0.0 (0 ratings)

The Stark Reality of Wealth Inequality

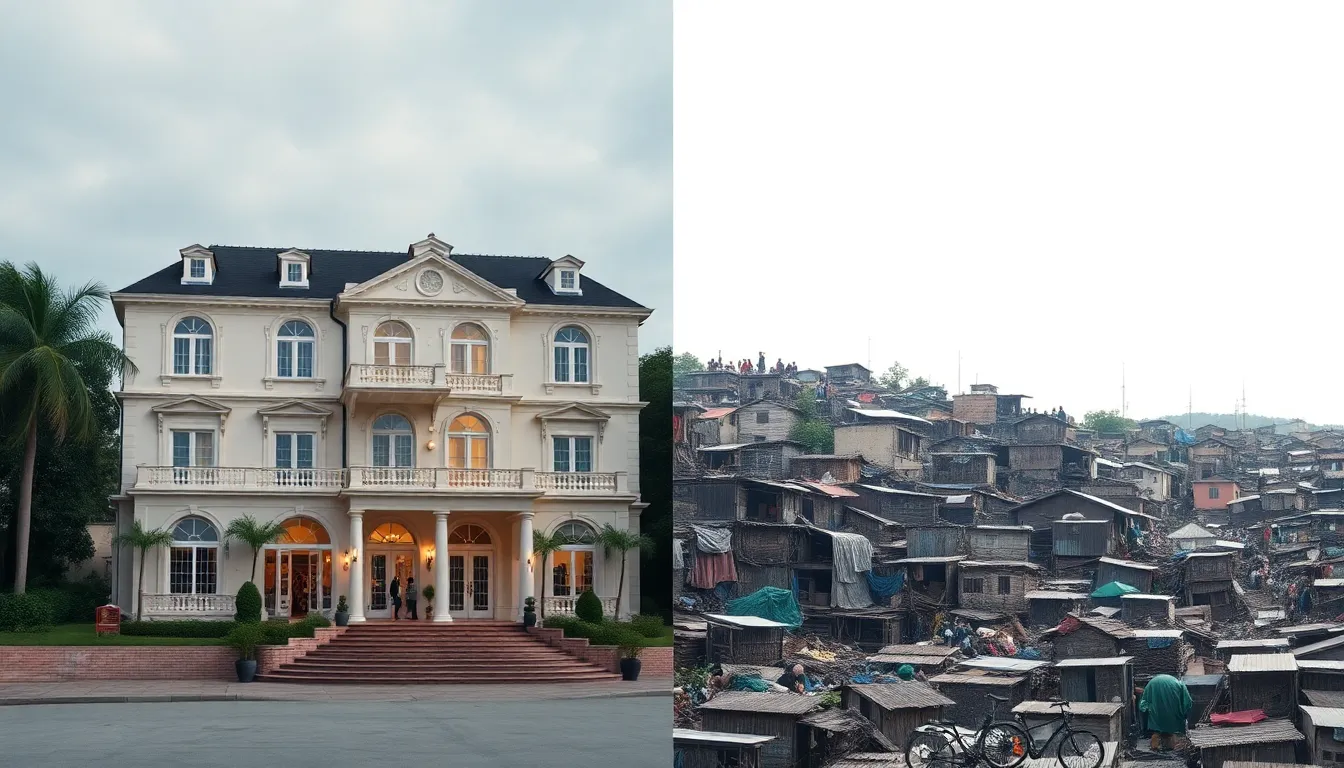
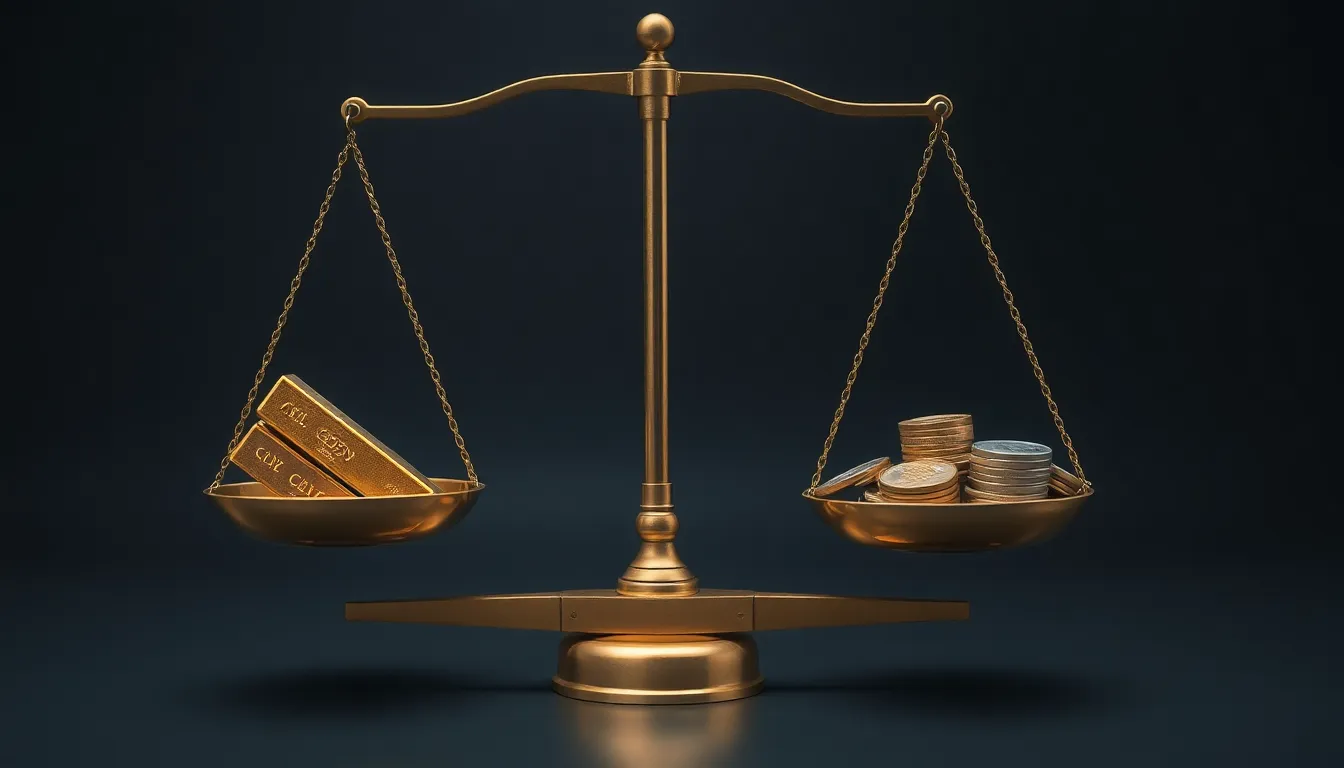
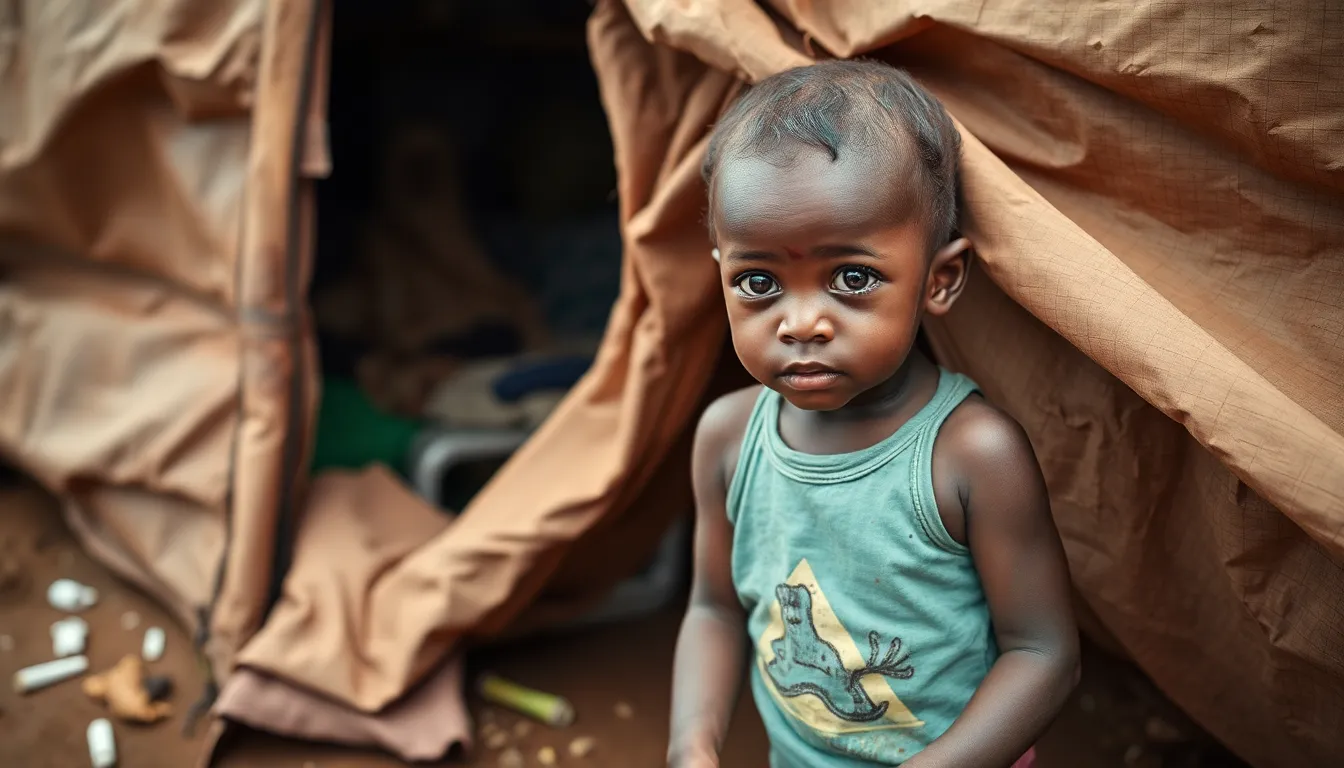
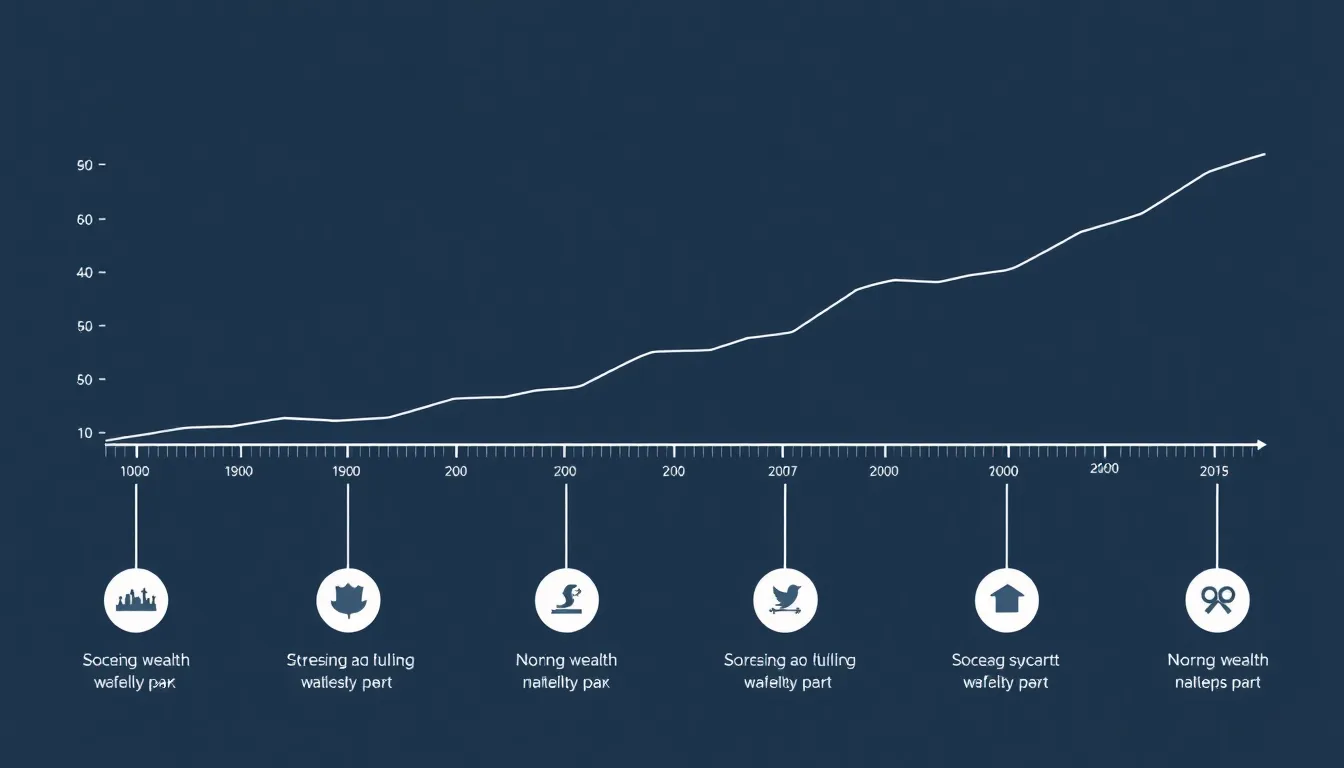
The richest 1% own 44% of global wealth, while the poorest 50% own just 1% (Credit Suisse, 2022).

The Stark Reality of Wealth Inequality
2

Global Income Distribution Map

  • This heatmap shows extreme wealth concentration in North America, Europe, and parts of Asia.
  • Africa and South Asia appear coldest, representing the lowest income regions globally.
  • The map uses World Bank data showing GDP per capita disparities exceeding 100:1 ratios.
Global Income Distribution Map
3

CEO vs Worker Pay: Shocking Ratios

  • In 1965, CEOs earned 20x average workers. Today it's 399x (Economic Policy Institute, 2023).
  • Amazon's CEO earns worker's annual salary in 9 seconds (Bloomberg analysis, 2022).
  • In Japan, the ratio is just 58:1 showing cultural differences in compensation norms.
CEO vs Worker Pay: Shocking Ratios
4

Poverty's Human Cost

  • 9 million die annually from poverty-related causes - more than wars (WHO, 2021).
  • Children in poorest quintile are 5x more likely to die before age 5 (UNICEF, 2022).
  • 70% of global poor are women, showing gendered impact of wealth inequality.
Poverty's Human Cost
5

Historical Trends in Inequality

  • Industrial Revolution began current inequality patterns (Piketty research, 2014).
  • Post-WWII equality gains are reversing since 1980s neoliberal policies.
  • French Revolution-era inequality ratios are now surpassed in some nations.
Historical Trends in Inequality
6

Solution 1: Progressive Taxation Reform

  • Top marginal tax rates fell from 91% (1950s US) to 37% today - needs reversal.
  • Global billionaire tax of 2% could fund education for 262 million children (Oxfam).
  • Closing tax havens could recover $427 billion annually for public services.
Solution 1: Progressive Taxation Reform
7

Solution 2: Living Wage Policies

  • MIT calculates real living wages exceed minimum wages in all US states.
  • Companies like Costco show higher wages increase productivity and retention.
  • UK Living Wage Foundation certified employers grew 30% annually since 2011.
Solution 2: Living Wage Policies
8

Obstacles to Change

  • Corporate lobbying spends $3.5 billion annually in US alone to block reforms.
  • Wealthy individuals hide approximately 10% of global GDP in tax havens.
  • Media ownership concentration distorts public perception of inequality issues.
Obstacles to Change
9

Successful Case Studies

  • Norway's sovereign wealth fund ($1.4 trillion) funds social programs from oil profits.
  • Rwanda reduced inequality by 6% points since 2000 through land reform policies.
  • Portugal's 2015-2019 socialist policies cut poverty rate from 26% to 17%.
Successful Case Studies
10

Conclusion: A Moral Imperative

  • Current wealth gaps are unsustainable and morally indefensible.
  • Proven solutions exist but require political will and public pressure.
  • Reducing inequality benefits all through economic stability and social harmony.
Conclusion: A Moral Imperative
1 / 10